
When a group of individuals take a test, their scores often follow a specific pattern of distribution. One such distribution is the normal distribution, also known as the bell curve. This distribution is characterized by a symmetrical shape, with the majority of scores falling near the mean or average score.
In a normal distribution, the scores are spread out from the mean in a predictable manner. The further away from the mean a score is, the less likely it is to occur. This means that most scores will be close to the average, with fewer scores being extreme outliers. This pattern of distribution is commonly seen in many areas of life, from academic test scores to physical characteristics like height or weight.
The normal distribution is a powerful tool that allows statisticians and researchers to analyze and interpret test scores. By understanding the shape and characteristics of this distribution, educators can identify areas where students may need additional support or intervention. Additionally, the normal distribution provides a basis for comparing individual scores to the larger group and determining how well a student performed relative to their peers.
Understanding the concept of normal distribution
The concept of normal distribution is a fundamental concept in statistics that helps us understand how data is distributed. In a normal distribution, the data is symmetrically distributed around the mean, with most of the values falling close to the mean and fewer values farther away from it. This distribution is often represented by a bell-shaped curve, known as the Gaussian curve.
A key characteristic of the normal distribution is that it is fully defined by its mean and standard deviation. The mean represents the average value of the data, while the standard deviation measures the dispersion of the data around the mean. In a normal distribution, approximately 68% of the data falls within one standard deviation of the mean, 95% falls within two standard deviations, and almost all of the data falls within three standard deviations.
This concept is particularly important when analyzing test scores. When we say that test scores are normally distributed, it means that most students score near the average, while fewer students score significantly higher or lower. This distribution allows us to make predictions about the performance of a group of students based on their test scores and compare individual scores to the overall group performance.
Understanding the concept of normal distribution is essential for many statistical analyses. It enables us to calculate probabilities, determine confidence intervals, and make predictions based on observed data. By recognizing the characteristics of a normal distribution, we can interpret data more effectively and draw meaningful conclusions from our analysis.
Characteristics of a normally distributed test score

A test score that follows a normal distribution possesses several key characteristics. Firstly, the distribution is symmetric, meaning that the scores are evenly distributed around the mean. This symmetry is often represented by a bell-shaped curve, known as the “normal curve” or “Gaussian distribution”.
Secondly, the mean, median, and mode of a normally distributed test score are all equal. This indicates that the most common score, or mode, is located at the center of the distribution. The mean represents the average score, while the median represents the middle score.
Another important characteristic of a normally distributed test score is the standard deviation. The standard deviation measures the spread of the scores around the mean. In a normal distribution, approximately 68% of the scores fall within one standard deviation of the mean, 95% fall within two standard deviations, and 99.7% fall within three standard deviations.
Normal distribution is often used in statistics to make predictions and infer population characteristics from a sample. It provides a foundation for various statistical tests and analyses. Understanding the characteristics of a normally distributed test score is essential for interpreting and analyzing the results of a test.
- The distribution is symmetric.
- The mean, median, and mode are equal.
- The standard deviation measures the spread of the scores.
- Approximately 68% of scores fall within one standard deviation of the mean.
- Approximately 95% of scores fall within two standard deviations of the mean.
- Approximately 99.7% of scores fall within three standard deviations of the mean.
The Importance of Normally Distributed Test Scores
The distribution of test scores is an important factor in evaluating the performance and abilities of students. When test scores follow a normal distribution, it allows for a more accurate assessment of student performance and comparison against a standardized scale. This type of distribution provides valuable insights into the overall distribution of scores, allowing educators to identify exceptional performances, areas of improvement, and the average level of achievement.
A normally distributed set of test scores allows for the calculation of various statistical measures, such as the mean, standard deviation, and percentiles. These measures are crucial in understanding the performance of students relative to one another and the expected level of achievement. By analyzing the distribution, educators can identify outliers, students who perform exceptionally well or poorly compared to the majority of their peers.
Furthermore, a normal distribution of test scores enables the use of parametric statistical methods in analyzing the data. Parametric methods, such as t-tests and ANOVA, rely on certain assumptions about the underlying distribution of the data. When test scores are normally distributed, it ensures that these assumptions are met, and the results obtained from statistical analyses are reliable and valid.
In addition, a normal distribution of test scores allows for the estimation of probability. This can be particularly useful in predicting the likelihood of a student achieving a certain score or passing a certain threshold. By understanding the distribution, educators can provide more accurate guidance and set realistic expectations for students.
In summary, the normal distribution of test scores plays a crucial role in accurately assessing student performance, comparing performances, identifying outliers, conducting statistical analyses, and estimating probabilities. It provides a standardized framework for evaluating and understanding student achievements, ultimately facilitating effective decision-making and educational interventions.
Factors affecting the normal distribution of test scores
The scores on a test are typically distributed in a normal distribution, meaning that the majority of scores fall around the average and fewer scores are found on the extremes. However, several factors can affect this distribution, leading to variations in the pattern of scores.
Difficulty level of the test: One of the key factors that can affect the normal distribution of test scores is the difficulty level of the test. If the test is too easy, many students may score high, resulting in a skewed distribution with a peak towards the right. On the other hand, if the test is too difficult, many students may score low, leading to a skewed distribution with a peak towards the left. A well-designed test with an appropriate level of difficulty will likely yield a more symmetrical normal distribution of scores.
Test preparation: Another factor that can impact the distribution of test scores is the level of test preparation. Students who have extensively prepared for the test are likely to perform better, resulting in a distribution that is shifted towards higher scores. Conversely, students who have not adequately prepared may achieve lower scores, leading to a distribution that skews towards lower scores. Therefore, the level of test preparation can influence the normal distribution of scores.
Individual differences: Individual differences among test-takers can also contribute to variations in the normal distribution of test scores. Factors such as prior knowledge, learning style, and cognitive abilities can affect how well a student performs on a test. As a result, the distribution of scores may show variations based on individual differences, with some students achieving higher scores and others achieving lower scores.
- In conclusion, several factors can affect the normal distribution of test scores. The difficulty level of the test, the level of test preparation, and individual differences among test-takers all play a role in shaping the distribution of scores. Understanding these factors can help educators and researchers interpret test results and make informed decisions based on the data.
Interpreting test scores based on the normal distribution
The normal distribution is a commonly used statistical distribution, particularly when analyzing test scores. Understanding how to interpret test scores within the context of the normal distribution can provide valuable insights into student performance and help identify areas for improvement.
When test scores are normally distributed, the majority of scores tend to cluster around the center of the distribution, with fewer scores at the extremes. This means that most students will earn scores near the average, while fewer students will earn scores that are significantly higher or lower.
Mean: The mean, or average, of the test scores provides a measure of central tendency. It represents the typical score that students tend to earn on the test. A higher mean indicates that students, on average, performed better, while a lower mean suggests lower performance.
Standard Deviation: The standard deviation measures the spread of the scores around the mean. A smaller standard deviation implies that the scores are closer together and less variable, while a larger standard deviation indicates more variability in the scores.
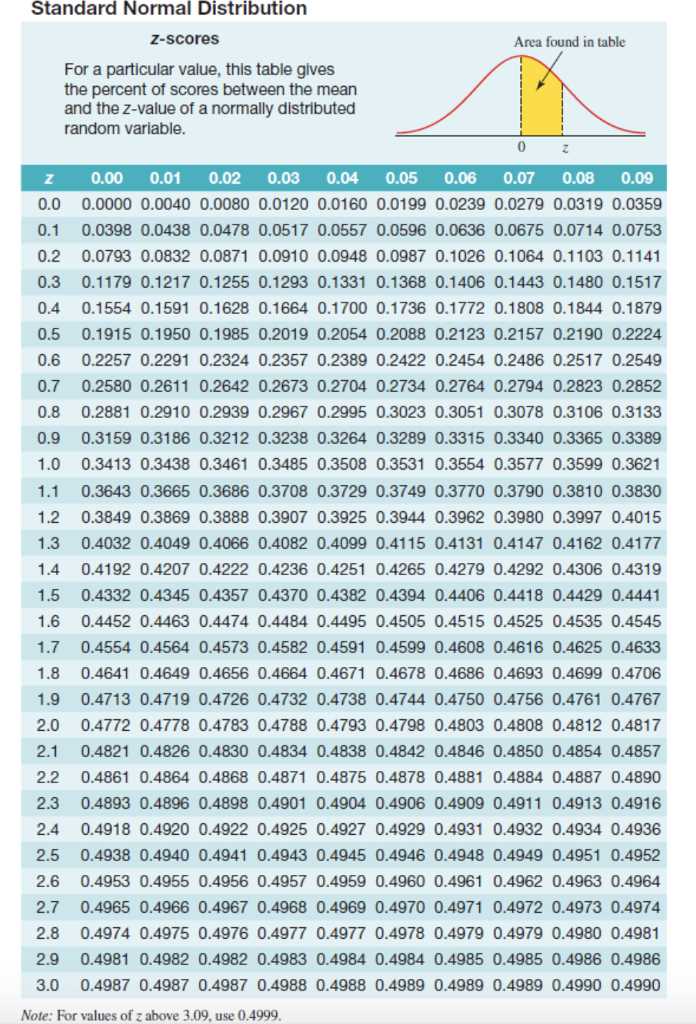
Interpreting test scores based on the normal distribution involves examining the individual scores in relation to the mean and standard deviation. The z-score, or standard score, can be calculated to determine the distance between an individual score and the mean in terms of standard deviations.
- A z-score of 0 indicates that the score is exactly at the mean.
- A positive z-score indicates that the score is above the mean.
- A negative z-score indicates that the score is below the mean.
By calculating the z-score, it is possible to determine the relative standing of a test score compared to other scores in the distribution. This information can be used to identify students who performed exceptionally well or poorly on the test.
In conclusion, understanding the normal distribution and how to interpret test scores within this framework can provide valuable insights into student performance. By examining the mean, standard deviation, and z-scores, educators can identify areas for improvement and tailor interventions to support students in their learning journey.